The Graphic Display functionality indicates in a diagram how parameter values change over time. In the upper part of the window, vehicle information is presented in order to make it easy to identify which vehicle's parameters are being shown in the diagram.
Each area of the window is explained in the subsections below.
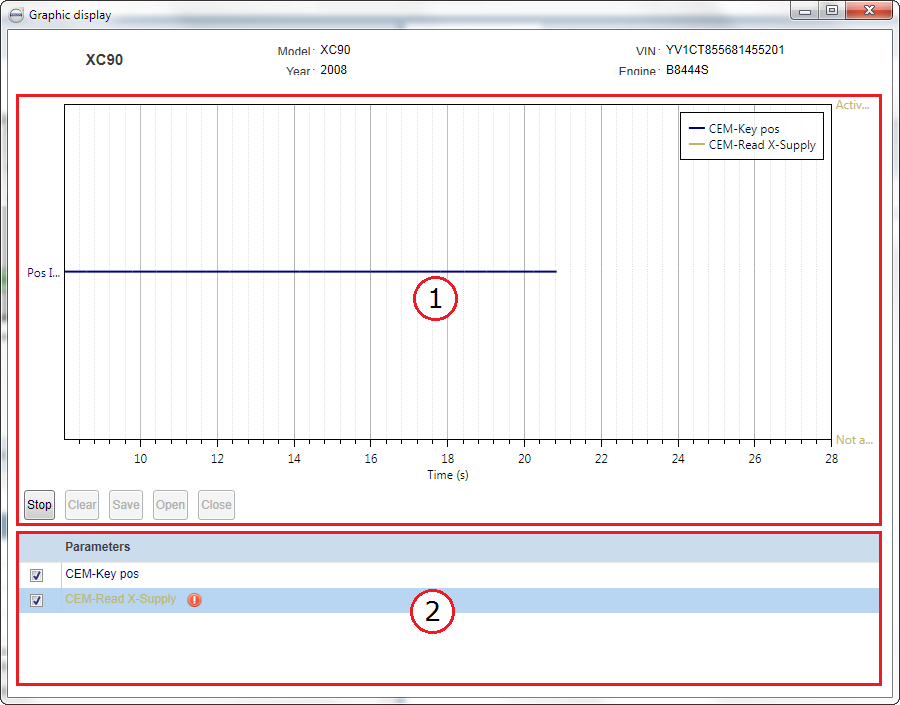
1. Diagram and action buttons
The diagram views graphically how selected parameters' values change over time. You can zoom the diagram in and out by using the scroll wheel on your mouse. The parameters to display are selected from the list of parameters in the lower part of the window.
The graph plots the selected parameters time on the X axis and the values on the Y axis. A unique colour is assigned for each parameter selected.
Below the diagram, the following action buttons are available:
|
Button |
Description |
|---|---|
|
/ |
The name of this button changes when you click it. Click to start plotting selected parameter values in the diagram. Click the button again to stop. |
|
|
Clear the diagram. |
|
|
Save the diagram as a |
|
|
Open a previously saved diagram ( |
|
|
Close an opened diagram ( |
2. List of parameters
From this list you select parameters to display in the diagram. This list is populated by your selection on the Parameters page. One single parameter or up to five parameters from same or different control modules can be displayed simultaneously.
A  icon is displayed if the vehicle is not returning information on selected parameter. In such case, the parameter cannot
be displayed in the diagram. Please send an error report if this problem occurs.
icon is displayed if the vehicle is not returning information on selected parameter. In such case, the parameter cannot
be displayed in the diagram. Please send an error report if this problem occurs.